
Catch an intermittent outage.
Return to the incident window after service recovers. Compare the affected flow with a healthy interval to find the first change.
The evidenceA timeline of the first failing exchange
Investigate a retry stormNetwork packet capture & analysis
Capuris records traffic at your network’s capture points. Search retained packets, compare observation points, and share the evidence your team needs to resolve an incident—even after service recovers.
How Capuris works
Start with the incident window. Follow the same exchange at two observation points. Give the next team a finding they can check against the original packets.
A slow application request
Illustrative workflow · sample data
Step 01 / 03
A user reports a delay at 09:41 UTC. Search the retained captures from the application and database sides for the same endpoints and incident window.
For this example, both capture points have synchronized clocks, equivalent filters, and no reported capture drops.
How to search packet historyhost 192.0.2.10 and host 198.51.100.20 and tcp port 5432| Time · UTC | Capture point | Observation | Elapsed |
|---|---|---|---|
| 09:41:12.004 | Application side | Request observed | +0 ms |
| 09:41:12.006 | Database side | Same request observed | +2 ms |
| 09:41:12.806 | Database side | Response observed | +802 ms |
| 09:41:12.808 | Application side | Same response observed | +804 ms |
Sample timestamps demonstrate the analysis method. This illustration is not a product screenshot, customer result, or performance benchmark.
Capuris Capture retains traffic at the observation point.
Capuris Control & Insight support packet search, comparison, and analysis.
Standard PCAP keeps the original exchanges available to your team’s tools.
Problems you can investigate
Outages, slow transactions, disputed ownership: begin with the problem in front of you, then narrow the traffic to the exchanges that explain it.
Return to the incident window after service recovers. Compare the affected flow with a healthy interval to find the first change.
Follow the same transaction at two capture points. Compare transit time, retransmissions, and the wait for a response.
Compare traffic before and after a firewall or routing change. Check which connections complete, reset, or disappear along the path.
Align captures from different observation points and identify where the flow changes. Give each vendor the same evidence to review.
Straightforward deployment
Match the appliance to measured peak traffic, required retention, and available interfaces. Use Capuris Control to configure recording and search, and Insight to analyze the retained traffic.
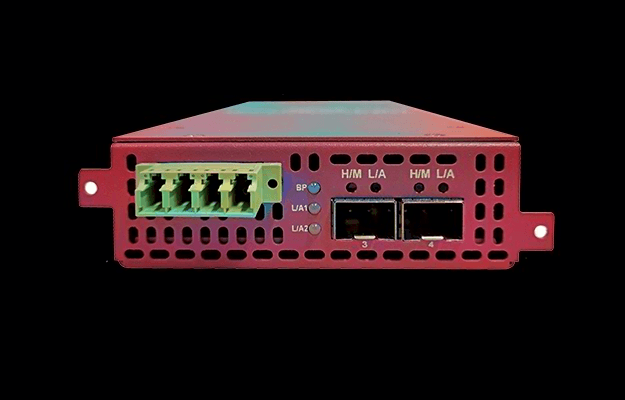
Capuris Capture family
| Model | Format | Capture profile | Typical use |
|---|---|---|---|
| Capture P1 | Portable | Up to 10 Gbps | Field work and targeted investigations |
| Capture R1 | 1U rack | Up to 100 Gbps | Branch, campus, and datacenter capture |
| Capture R2 | 2U rack | Up to 200 Gbps | High-volume capture and greater local retention |
| Capture Virtual | Virtual appliance | Host-dependent | Labs, cloud networks, and virtual environments |
Size for the traffic you will retain. Physical rates are model-level aggregate maxima, not per-port guarantees. Achievable recording performance depends on adapters, packet sizes, storage, filtering, compression, and host configuration. Virtual capture also depends on the mirror source, virtual networking, and host scheduling.
Validate recording under representative load and check capture-drop counters. Confirm current interfaces, usable storage, and retention with Capuris. Read the sizing guidance or review capture validation.
About Capuris
Since 2016, Capuris has combined packet-capture hardware with search and analysis software. We help network and security teams reconstruct incidents, compare what different capture points recorded, and put reviewable evidence in the hands of the team investigating the cause.
Plan for the next incident.